Maps and Exploration
Cartogram
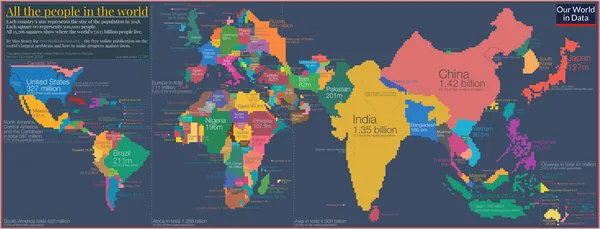
A cartogram, also called a value-area map or an anamorphic map, is a thematic map of a set of features (countries, provinces, etc.), in which their geographic size is altered to be directly proportional to a selected variable, such as population or travel time An area cartogram manipulates the area of each region, whereas a linear cartogram distorts the length of a linear feature. Geographic space itself is thus warped, sometimes extremely, in order to visualize the distribution of the variable. It is one of the most abstract types of map; in fact, some forms may more properly be called diagrams. They are primarily used to display emphasis and for analysis as nomographs. Cartograms leverage the fact that size is the most intuitive visual variable for representing a total amount. In this, it is a strategy that is similar to proportional symbol maps, which scale point features, and many flow maps, which scale the weight of linear features. However, these two techniques only scale the map symbol, not space itself; a map that stretches the length of linear features is considered a linear cartogram (although additional flow map techniques may be added). Once constructed, cartograms are often used as a base for other thematic mapping techniques to visualize additional variables, such as choropleth mapping.
Also on this shelf
Church of Saint-Louis, La Flèche.
Gotthard Base Tunnel.
See also
Uncatalogued shelfText from Wikipedia; plate via Wikimedia Commons. Text CC BY-SA 4.0; plate freely licensed (see Commons). Source record. Images and catalogue data are reproduced from open-access collections.