Invention and Engineering
Dot distribution map
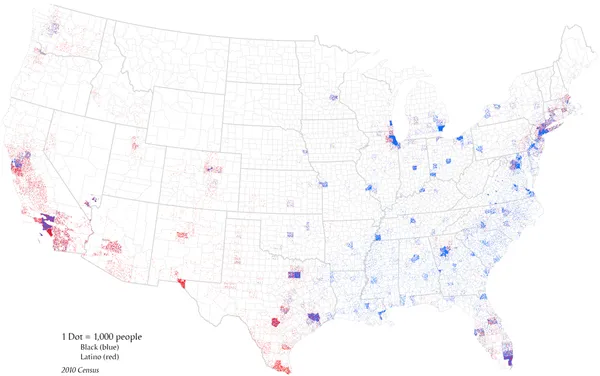
A dot distribution map (or a dot density map or simply a dot map) is a type of thematic map that uses a point symbol to visualize the geographic distribution of a large number of related phenomena. Dot maps are a type of unit visualizations that rely on a visual scatter to show spatial patterns, especially variances in density. The dots may represent the actual locations of individual phenomena, or be randomly placed in aggregation districts to represent a number of individuals. Although these two procedures, and their underlying models, are very different, the general effect is the same.
Also on this shelf
GER Class S69.
Benjamin Disraeli.
See also
Uncatalogued shelfText from Wikipedia; plate via Wikimedia Commons. Text CC BY-SA 4.0; plate freely licensed (see Commons). Source record. Images and catalogue data are reproduced from open-access collections.