Astronomy and Space
Hertzsprung–Russell diagram
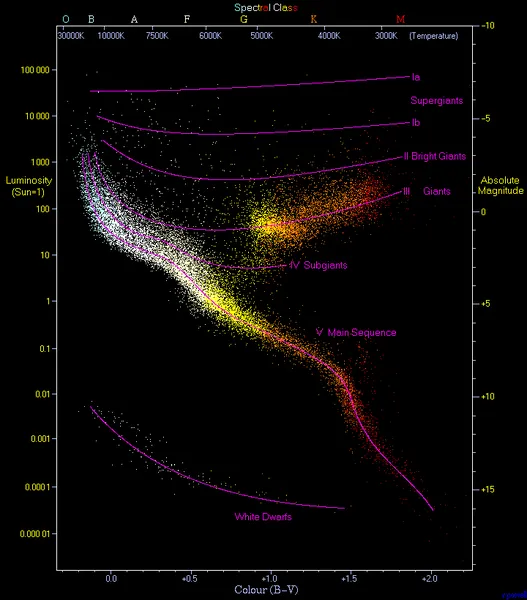
A Hertzsprung–Russell diagram (abbreviated as H–R diagram, HR diagram or HRD) is a scatter plot of stars showing the relationship between the stars' absolute magnitudes or luminosities and their stellar classifications or effective temperatures. It is also sometimes called a color magnitude diagram. The diagram was created independently in 1911 by Ejnar Hertzsprung and by Henry Norris Russell in 1913, and represented a major step towards an understanding of stellar evolution.
Also on this shelf
List of European Space Agency programmes and missions.
Discovery and exploration of the Solar System.
See also
Uncatalogued shelfText from Wikipedia; plate via Wikimedia Commons. Text CC BY-SA 4.0; plate freely licensed (see Commons). Source record. Images and catalogue data are reproduced from open-access collections.