Astronomy and Space
Hertzsprung–Russell diagram
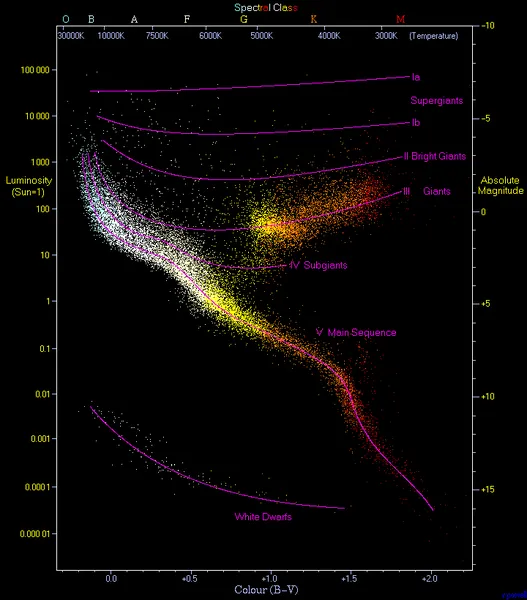
A Hertzsprung–Russell diagram (abbreviated as H–R diagram, HR diagram or HRD) is a scatter plot of stars showing the relationship between the stars' absolute magnitudes or luminosities and their stellar classifications or effective temperatures. It is also sometimes called a color magnitude diagram. The diagram was created independently in 1911 by Ejnar Hertzsprung and by Henry Norris Russell in 1913, and represented a major step towards an understanding of stellar evolution.
Also on this shelf
CubeSat for Solar Particles.
Laika.
See also
Uncatalogued shelfText from Wikipedia; plate via Wikimedia Commons. Text CC BY-SA 4.0; plate freely licensed (see Commons). Source record. Images and catalogue data are reproduced from open-access collections.